In 1850, Britain was the top carbon emitter, now it’s China
The U.S. is the world’s worst polluter of all times and the U.A.E. emitted the largest volume of CO2 per capita, analysis says.
Carbon dioxide emissions are the primary driver of global climate change and the world’s wealthiest countries bear the main responsibility. Since the Industrial Revolution in the 19th century, the source of worst air pollution shifted from Europe to North America and Asia today.
An analytical report from Our World in Data shows how this responsibility is shared between 15 biggest economies since 1850 till 2022.
More to read:
Scientists gene-edit plants for enhanced CO2 capture and storage
The United Kingdom was the pioneer of the Industrial Revolution and dominated the chart of carbon emissions throughout most of the 19th century. In 1888, however, the United States toppled the U.K. to become the largest CO2 emitter as the American Civil War was over and the country rolled on a path of rapid infrastructure expansion westwards.
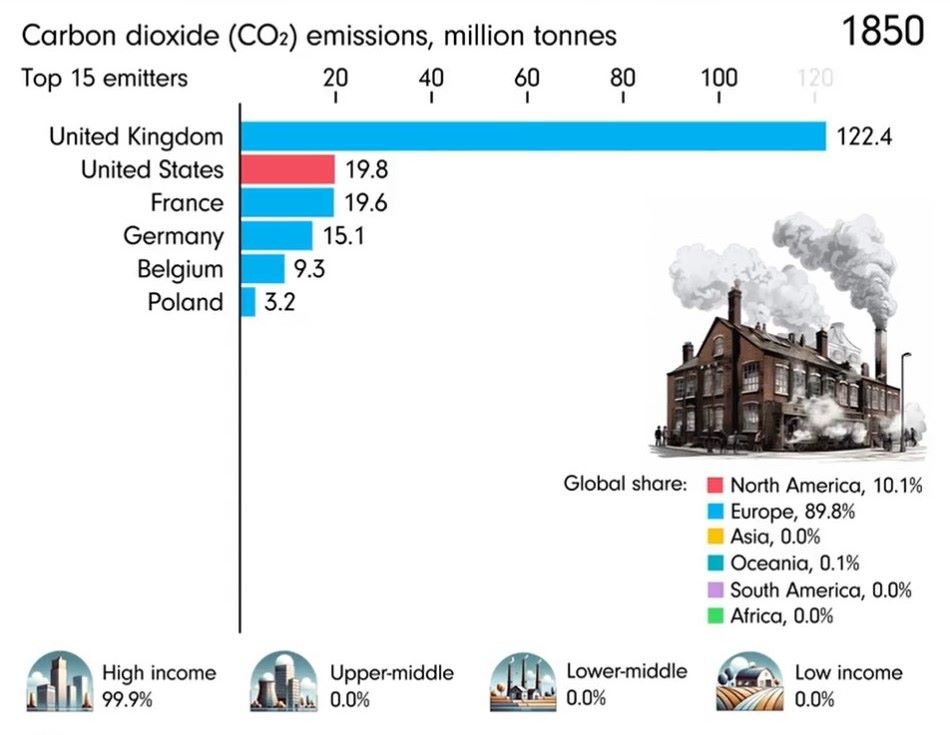
Other notable carbon emitters were France, Germany, Belgium, and Poland. The rich countries accounted between 99% and 100% of CO2 emissions, according to the report (see the tables, thanks to the VisualCapitalist.com).
Ahead of the World War II, the U.S. emitted 2 billion tons of CO2, followed by Germany with almost 660 million tons, the U.K.
with 470 million tons, and the Soviet Union with 266 million tons.

Interestingly, in 1940, the high income countries contributed 83.3% of global carbon dioxide emissions, compared to 11.4% from upper-middle economies or 4.5% from lower-middle economies; low income countries were responsible for just 0.3% of CO2 emissions, the analysis asserts.
The railway sector and maritime shipping fleet were the major polluters, but the booming industrial factories left a heavy footprint too.
In the 1950s, thanks to its territorial expansion, the Soviet Union/Russia surpassed Germany – which was divided into two separate states – to become the second-largest carbon emitter. China rose to the fourth place.
More to read:
Researchers discover huge methane deposits in Norwegian permafrost. And they are “migrating”
In the 1990s, however, China experienced a tremendous industrial growth and so did its carbon emissions. The Middle East advanced, too, due to a strong global oil demand. It was in 2006 when China surpassed the U.S. as the world’s largest emitter.
During this period, the aviation sector became one of the top emitters thanks to a thriving commercial air traffic across the globe.

Currently, the volume of Chinese carbon emissions is more than double that of the U.S. - almost 11.4 billion tons compared to 5 billion tons in the U.S. Historically, however, the latter has emitted more CO2 in cumulative terms.
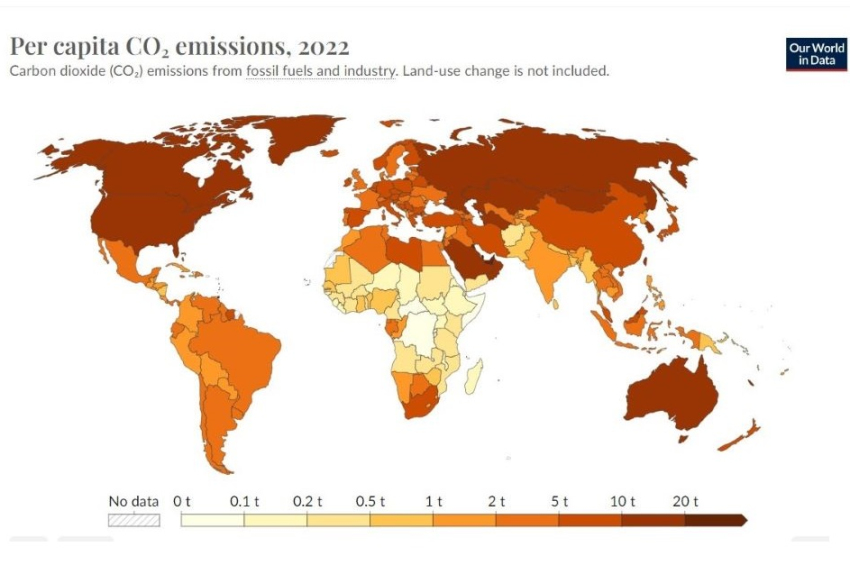
In 2022, the world emitted more than 37 billion tons of carbon dioxide and upper-middle sized economies accounted for almost half of that volume.
Per capita, the United Arab Emirates was the worst polluter that year – 25.8 tons, followed by Kuwait with 26.6 tons. In descending order, other major CO2 emitters per capita are Saudi Arabia (18.2 t), Oman (15.7 t), Australia (15 t), the U.S. (14.9 t), Canada (14.2 t), Russia (11.4 t), and Mongolia (11.2 t).
If anything, blame oil and gas production mainly.
Somali, the Central African Republic, and the Democratic Republic of Congo are on the opposite side with less than 0.1 ton per capita.
Carbon emissions are the primary cause of the greenhouse effect and global warming. The full dataset is here.
***
NewsCafe relies in its reporting on research papers that need to be cracked down to average understanding. Some even need to be paid for. Help us pay for science reports to get more interesting stories. Use PayPal: office[at]rudeana.com or paypal.me/newscafeeu.